In this article
Your HVAC cost per closed job is your acquisition spend divided by the jobs you won. A low lead price can still produce an expensive job if few leads become estimates. Here’s how to compare lead platforms, a retainer agency, and pay-per-appointment using the same starting point.
Stop looking at cost per lead alone
A $75 lead that never answers the phone costs you $75. A $75 lead looking for a $200 repair still costs you $75. A lead that buys a replacement may be worth the cost. The invoice alone doesn’t tell you which one you bought.
Follow the money all the way to the signed job. Track leads, qualified conversations, booked estimates, shown estimates, and closed jobs separately. If you lump those stages together, a busy calendar can hide a weak sales result.
- LeadA contact arrives
- QualifiedThe project fits
- BookedA time is set
- ShownThe estimate happens
- ClosedYou win the job
Count what reaches each stage. A booked estimate is still one step away from a shown estimate.
Use the same cost rules for every option. Include lead fees or ad spend, the agency fee, and any extra calling or software costs you’re comparing. Keep installation labor and equipment costs separate when measuring acquisition cost; include them when you assess job profit.
The setup: 10 shown estimates
Start with 10 qualified homeowners who attend an in-home replacement estimate. Then ask what you spent to get there and what share your sales team closes.
This worked example uses a 38.3% close rate. It comes from a historical, contractor-reported sample recorded in April 2026: 164 closed jobs from 428 shown estimates delivered by Local Leap Media. It is not an independently audited industry benchmark, a current company-wide rate, or a promise of your results.
For consistent arithmetic, the example uses the rounded rate of 38.3% throughout. Ten shown estimates at that rate produce 3.83 expected closed jobs. Real months end with whole jobs; the fractional figure lets us compare the models without rounding one row in its favor.
The lead cost, lead-to-estimate conversion, retainer spend, and low-volume scenarios below are illustrative assumptions. They are not measured averages for Angi, Thumbtack, or retainer agencies. Substitute your own invoices and results.
Model 1: Buying leads
- What triggers the fee
- A billable lead
- Your team handles
- Calling, qualifying, booking, and the sale
Suppose you buy 100 leads at $80 each. You spend $8,000. After calling, qualifying, booking, and handling cancellations, those leads produce 10 shown replacement estimates.
That is an assumed 10% lead-to-shown-estimate rate. It could be better or worse in your market. A homeowner submitting a request and a homeowner attending an estimate are different events.
Angi’s own lead FAQ says prices vary by task, location, and demand; leads are not guaranteed jobs. It also says a project request can be matched with up to five pros. Check the exact product and terms rather than assuming every lead is exclusive or shared in the same way.
- Lead spend: $8,000.
- Shown estimates: 10.
- Expected jobs at 38.3%: 3.83.
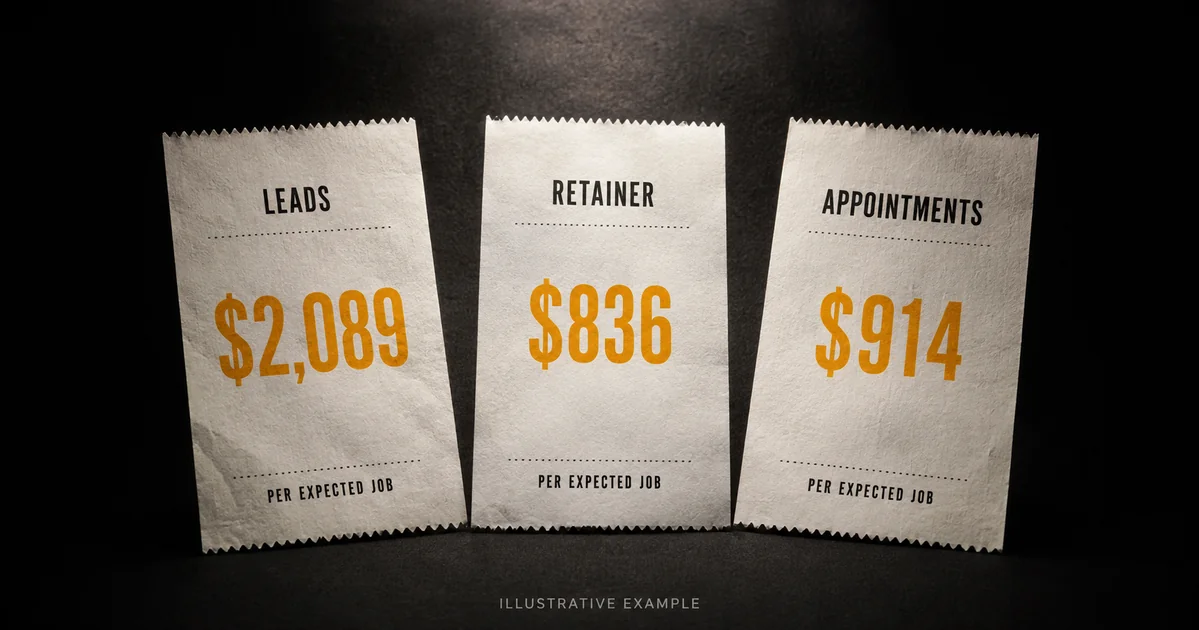
- Acquisition spend per expected job: $8,000 ÷ 3.83 ≈ $2,089.
Your calling and follow-up costs are additional unless already included in your lead price. A team with strong follow-up may get more estimates from the same leads. Measure that conversion before blaming the channel or increasing the budget.
Model 2: A retainer agency
- What triggers the fee
- The agreed service period
- Your team handles
- Calls and booking in this example, plus the sale
Now suppose the agency fee and ad spend total $3,200 for the month. In this example, your team handles calls and booking, and the campaign produces the same 10 shown estimates.
At 38.3%, that is again 3.83 expected jobs. $3,200 ÷ 3.83 ≈ $836 per job, before any extra internal follow-up cost.
The retainer is the cheapest of these three example rows. A useful comparison should say that plainly. Pay-per-appointment doesn’t automatically win on price.
The tradeoff is how the bill changes when volume changes. If that same $3,200 produces five shown estimates, expected closes fall to 1.915. Cost per expected job rises to roughly $1,671. If there are no closes, you cannot calculate a finite cost per closed job for that period. Report the spend and zero jobs.
Read the agreement. Some agencies include calling, appointment setting, or performance terms. Others only manage ads. Compare the service you’re actually buying, not the label on the proposal.
Model 3: Pay-per-appointment
- What triggers the fee
- A billable shown appointment
- Your team handles
- The in-home estimate and the sale
At Local Leap Media’s $350 core price per shown appointment, 10 billable shown appointments cost $3,500. Our PPA offer includes ad spend, campaign management, qualification, and booking. Your team handles the estimate and the sale.
- Ads and lead follow-up are handled for you.
- Qualified appointments are booked into your calendar.
- We don’t resell the leads we generate for your campaign.
- No-shows aren’t billable under our shown-appointment model.
Using the same 38.3% assumption: $3,500 ÷ 3.83 ≈ $914 per expected closed job.
The appointment is the purchased outcome. The job still depends on the homeowner, your offer, financing, and your sales process. Exclusive delivery does not prevent a homeowner from independently seeking another quote.
The comparison, on equal terms
Every row below assumes 10 shown estimates and the same close rate. The table separates acquisition spend from internal work so you can see what the examples include.
| What you measure | Lead purchase example | Retainer example | Local Leap Media PPA |
|---|---|---|---|
| Acquisition spend | $8,000 | $3,200 | $3,500 |
| Shown estimates | 10 | 10 | 10 |
| Expected jobs at 38.3% | 3.83 | 3.83 | 3.83 |
| Spend per expected job | ~$2,089 | ~$836 | ~$914 |
| Who calls and books? | Your team | Your team in this example | Included |
| Extra internal follow-up cost | Not included above | Not included above | Pre-estimate follow-up included |
| What triggers the fee? | A billable lead | The agreed service period | A billable shown appointment |
The retainer example is about $78 less per expected job than PPA before internal follow-up costs. Whether that saving survives your team’s workload is a question for your actual numbers.
What happens in a bad month?
A lower cost in a good month doesn’t tell you who carries the risk in a slow one.
Lead purchase example: you spend $6,400 on 80 leads and close one job. Acquisition spend per closed job is $6,400 before extra follow-up costs. Some unclosed opportunities may remain in your pipeline; don’t count them as wins yet.
Retainer example: you spend $3,200, get one shown estimate, and close nothing. You did meet one homeowner, but there is no closed job to spread the cost over. The next bill depends on your agreement, not on whether that homeowner buys.
PPA example: you receive seven billable shown appointments at $350 and close two jobs. You spend $2,450, or $1,225 per closed job. You pay less than for 10 appointments because fewer billable appointments happened. Two closes here are a scenario, not a promised conversion rate.
Run this with your numbers
Pick a group of leads old enough for the estimates and sales to have happened. Comparing this week’s spend with last month’s wins can give you a misleading result.
- Add the acquisition costs for that group: lead fees, agency fees, ad spend, and relevant follow-up costs.
- Count booked estimates, shown estimates, and closed jobs separately.
- Divide acquisition spend by closed jobs. If there are no jobs, report that directly.
- Compare the result with your gross profit per job, not just the sale price.
- Find the weakest stage before you buy more volume: contact, qualification, booking, attendance, or closing.
The next question for a provider is simple: what exactly am I paying for, and which work stays on my team? Get the answer in writing.
The FTC’s 2023 HomeAdvisor order concerned misleading claims about leads. That historical enforcement action is a reason to check evidence and terms; it does not establish the quality of a current lead you might buy.
For budget controls, Thumbtack also explains how pros can set lead prices and a weekly budget. Those controls answer how much you can spend. Your own job records answer whether that spending worked.
Want to compare your current setup with our PPA offer? Book a growth call with Local Leap Media. Bring your spend, shown estimates, and closed jobs. We’ll work through the same calculation.
Sources and data notes
Source review: September 7, 2026. The historical 164-of-428 sample was recorded internally in April 2026 and reflects contractor-reported closes. The comparison uses 38.3% as a shared modeling assumption, not evidence that different channels close equally. Dollar results are rounded to the nearest dollar.
Lead purchase and retainer inputs are illustrative. The $350 PPA input reflects Local Leap Media’s published core offer; actual eligibility and billing terms belong in the agreement. Source links in the article support the specific platform descriptions and historical enforcement reference, not the modeled conversion rates.